The graph shows the monthly revenue in millions of dollars of a growing company after the company doubled its advertising. Use the graph to solve the problem. 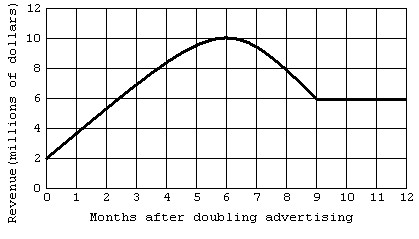 Estimate the minimum revenue during the period of time plotted on the graph.
A. $1 million
B. $6 million
C. $2 million
D. $4 million
Answer: C
You might also like to view...
Solve.In real estate, a house's selling price P is found by adding the real estate agent's commission C to the amount A that the seller of the house receives:  Jorie's house sold for $190,000. Her real estate agent received a commission of $11,400. How much did Jorie receive?
A. $178,600 B. $201,400 C. $178,500 D. $178,700
Solve the inequality  . Round your answer to two decimal places.
?
. Round your answer to two decimal places.
?
A. ?
B. 
C. ?
D. ?
Solve.A company that manufactures hospital beds has fixed monthly costs of $240,000. The average cost per bed, C, for the company to manufacture x beds per month is modeled by the formula C =  How many hospital beds can be manufactured per month at an average cost of $850?
A. 800 beds B. 900 beds C. 950 beds D. 675 beds
Find the exact value of the logarithmic expression.log4 
A. 
B. 3
C. - 
D. -3