Deborah has 80 hours per week to devote to working or to leisure. She is paid an hourly wage and can work at her job as many hours a week as she likes.
The following graph illustrates Deborah's weekly income-leisure tradeoff. The three lines labeled BC1BC1, BC2BC2, and BC3BC3 illustrate her time allocation budget at three different wages; points A, B, and C show her optimal time allocation choices along each of these constraints.
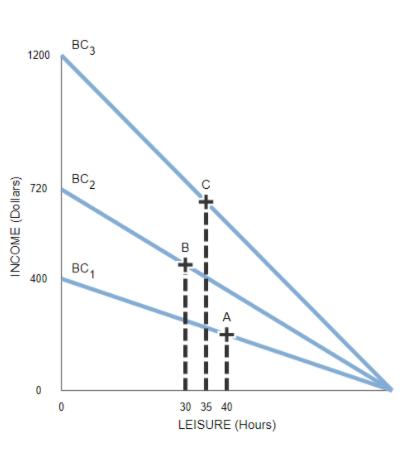
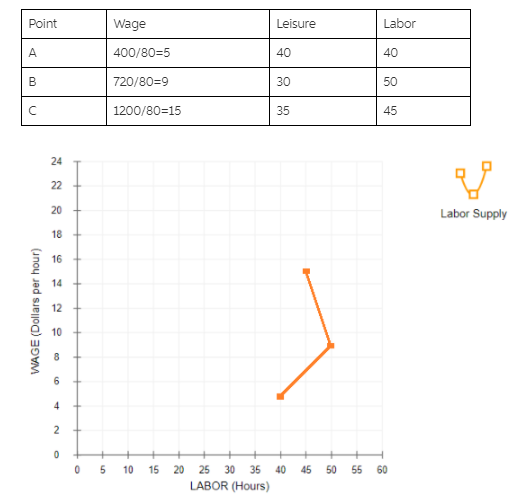
For each of the points listed, use the preceding graph to complete the following table by indicating the hourly wage at each point and how many hours per week Deborah will spend during leisure activities versus working.
| Point | Wage | Leisure | Labor |
|---|---|---|---|
| (Dollars per hour) | (Hours) | (Hours) | |
| A | |||
| B | |||
| C |
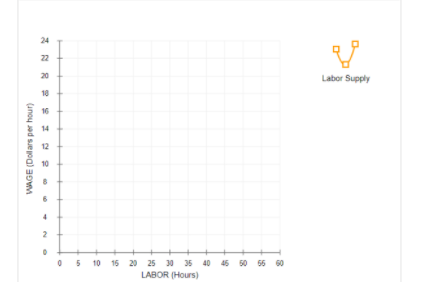
Based on the data you entered in the preceding table, use the orange curve (square symbols) to plot Deborah's labor supply curve on the following graph, showing how much labor she supplies each week at each of the three wages.
Suppose that Deborah's initial budget line was BC1BC1 and that it then changed to BC2
BC2; therefore, Deborah's optimal time allocation choice shifted from A to B. As a result of this change, Deborah's opportunity cost of leisure (decreased/increased) , and she chose to consume (less/more) leisure. Consequently, in this region, the (income/substitution) effect dominates the (income/substitution) effect. The corresponding portion of Deborah's labor supply curve is (upward sloping/downward sloping) .
Answer:
Blanks:-
1- Increased
2- More
3- Income
4- Substitution
5- Downward sloping
You might also like to view...
Randomization based on covariates is
A) not of practical importance since individuals are hardly ever assigned in this fashion. B) dependent on the covariances of the error term (serial correlation). C) a randomization in which the probability of assignment to the treatment group depends on one of more observable variables W. D) eliminates the omitted variable bias when using the difference estimator based on Yi = ?0 + ?1Xi + ui, where Y is the outcome variable and X is the treatment indicator.
If marginal cost is constant, what happens to a market if it alters from perfect competition to monopoly without any change in the position of the market demand curve or any variation in costs?
A) Consumer surplus increases, and the previously existing deadweight loss decreases. B) Consumer surplus increases, and the previously existing deadweight loss increases. C) Consumer surplus is eliminated, and an equal-sized deadweight loss is created. D) Consumer surplus decreases in size, and a deadweight loss is created.
Which of the following is an example of wealth?
a. a yearly salary of $40,000 b. a mutual fund balance of $1,000 c. rental payments of $3,000 per month d. stock dividends of $500 per quarter
Which of the following correctly describes a shortage? Question 4 options:
A. Some buyers are unable to buy as much as they want at the current price. B. The quantity demanded equals the quantity supplied but the price is less than the equilibrium price. C. The quantity demanded equals the quantity supplied but the price is higher than the equilibrium price. D. The quantity demanded is less than the quantity supplied. E. Some sellers are unable to sell all they want to at the current price.