Rationalize the denominator and simplify. Assume that all variables represent positive real numbers.
A. 
B. -22
C. -1
D. 
Answer: A
Mathematics
You might also like to view...
Determine how many components the graph has.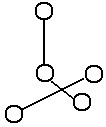
A. 2 B. 1 C. 5 D. 3
Mathematics
Find the standard form of the equation of the following hyperbola.
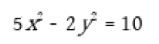
a. 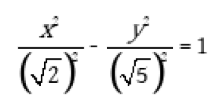
b. 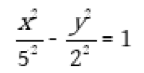
c. 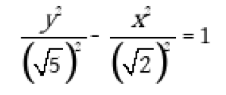
d. 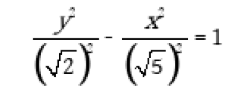
e. 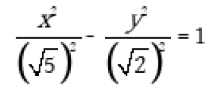
Mathematics
Find all points where the function is discontinuous.
A. x = 1, x = 5 B. x = 4 C. x = 1, x = 4, x = 5 D. None
Mathematics
Solve the problem.The population (in hundred thousands) for the Colonial United States in ten-year increments for the years 1700-1780 is given in the table. (Source: 1998 Information Please Almanac)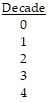 ?
?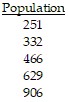 ?
?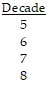 ?
?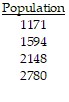 State whether the data can be more accurately modeled using an exponential function or a logarithmic function. Using a graphing utility, find a model for population (in
hundred thousands) as a function of decades since 1700. What will be an ideal response?
Mathematics