Use the vertical line test to determine whether or not the graph is a graph of a function.
A. function
B. not a function
Answer: A
You might also like to view...
Set up the iterated integral for evaluating 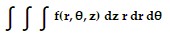 over the given region D. DD is the right circular cylinder whose base is the circle
  in the xy-plane and whose top lies in the plane
  .
.
A. 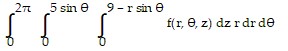
B. 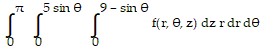
C. 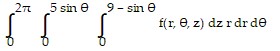
D. 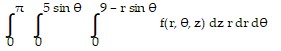
Evaluate the integral.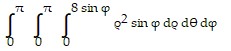
A.  ?2
?2
B.  ?2
?2
C.  ?2
?2
D. 64?2
Solve. Write results using scientific notation.The national debt of a small country is $6,960,000,000 and the population is 2,665,000. What is the amount of debt per person?
A. $2.61 B. $2.61 x 10⁶ C. $26.10 x 10² D. $2.61 x 10³
Attending concerts is a favorite form of entertainment for many people. The graph shows concert attendance gradually increased from 1994 to 2004 for concerts at a small town's outdoor concert venue. In 1994, the average attendance was 935, as represented by the point src="https://sciemce.com/media/4/ppg__tttt0623191144__f1q88g3.jpg" alt="" style="vertical-align: 0.0px;" height="213" width="361" />The line segment has an equation that can be written in the form y = ax + b. Use the coordinates of point P with  In 2004, the average attendance was 2350, as represented by the point
  We can find an equation of the line segment PQ using a system of equations, and then we can use the equation to approximate the attendance in any of the years between 1994 and 2004.
  and
and  , write an equation in the variables a and b.
A. y = 2004a + b
B. 2350 = 2004a + b
C. 2004 = 2350a + b
D. y = 2350a + b