Graph shows the number of sports utility vehicles  sold in the United States. represents sales in year t in thousands of vehicles. Use the graph to estimate the smallest value of
 ![]()
src="https://sciemce.com/media/2/ppg__cognero__1.2_Functions_and_Models__media__89cc5952-05c2-47f8-bfde-6647f9dee7d3.PNG" data-wiris-created="true" class="wirisformula" /> for  .
.
?

?
Please enter your answer as a number without the units.
Fill in the blank(s) with the appropriate word(s).
300,000
You might also like to view...
Find  by using the Chain Rule. Express your final answer in w =
  ; x = cos s2t, y = sin s2t, z = s2t2
A. 
B. 
C. 
D. 
Solve the problem.The following data give the distribution of the types of houses in a town containing 50,000 houses. Make a pie chart for these data.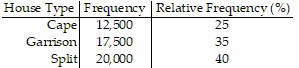
What will be an ideal response?
Choose the best answer.A car's gas tank capacity is
A. 67 L B. 67 kL C. 67 cm3 D. 67 mL
Write the number in standard form.2.19 × 10-4
A. 0.0000219 B. -219,000 C. 0.000219 D. 0.00219