There has been an increase in the demand for chicken. This change can be shown graphically as a:
A. shift in the demand curve to the left.
B. movement along the demand curve to the left.
C. shift in the demand curve to the right.
D. movement along the demand curve to the right.
Answer: C
You might also like to view...
Refer to Figure 15-7. Suppose the economy is in a recession and the Fed pursues an expansionary monetary policy. Using the static AD-AS model in the figure above, this would be depicted as a movement from
A) A to E. B) A to B. C) B to C. D) C to B. E) C to D.
Discrimination based on institutional factors occurs when:
A. women postpone having children in order to succeed professionally. B. women remain in low-paying jobs because of family responsibilities. C. employers hire a man who is more qualified than a woman. D. employers pay women less than men for doing the same job.
A leftward shift of a supply curve is called a(n):
A. decrease in quantity supplied. B. increase in supply. C. decrease in supply. D. increase in quantity supplied.
Refer to the information provided in Figure 23.8 below to answer the question(s) that follow.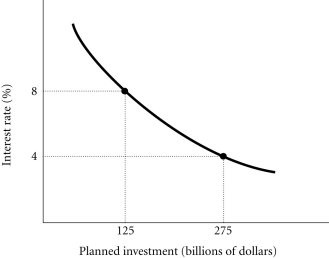 Figure 23.8Refer to Figure 23.8. The amount of planned investment ________ if the interest rate falls from 8% to 4%.
A. remains at $125 billion B. rises by $150 billion C. drops by $150 billion D. remains at $275 billion