Solve.The following graph shows the number of male and female athletes at a university over a four-year period. 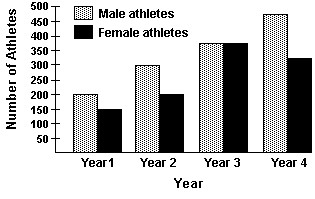 Which year had the smallest number of male athletes? What was the total number of male athletes that year?
A. Year 2; 300 athletes
B. Year 1; 150 athletes
C. Year 1; 200 athletes
D. Year 4; 475 athletes
Answer: C
Mathematics
You might also like to view...
Find a quadratic function that best fits the data. Give answers to the nearest hundredth.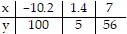
A. y = 1.01x2 - 0.66x + 2.11 B. y = 0.53x2 + 4.68x - 2.5 C. y = 1.01x2 + 0.66x + 2.11 D. y = 0.09 + 8.33x - 6.85
Mathematics
Find the relative maxima and relative minima, if any, of the function. Otherwise, answer none.
?
 ?
Relative minima: __________
?
Relative maxima: __________
?
Relative minima: __________
?
Relative maxima: __________
What will be an ideal response?
Mathematics
Solve by the substitution method.x + y = -1y = x - 8
A. Infinitely many solutions B. (0, -9) C. No solution D. (-1, -8)
Mathematics
Solve the equation. = y
= y
A. {6} B. {6, -2} C. ? D. {4}
Mathematics