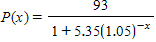
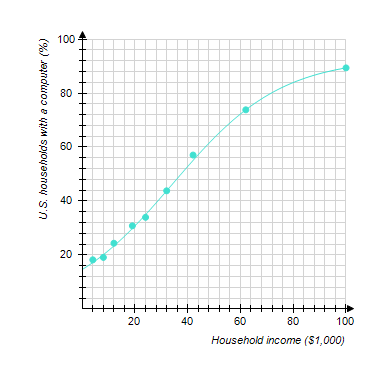
The graph shows the actual percentage of U.S. households with a computer as a function of household income (the data points) and a logistic model of these data (the curve). The logistic model is
?
?
where x is the household income in thousands of dollars. According to the model, what percentage of extremely wealthy households had computers?
?
?
A.  is close to
  .
.
B. is close to .
.
C. is close to .
.
D. is close to .
.
E. is close to .?
.?
Answer: E
You might also like to view...
Compute the gradient of the function at the given point.

A. -  i -
i -  j
j
B. -  i -
i -  j
j
C. -  i +
i +  j
j
D.  i -
i -  j
j
Solve the problem.Since 1960, the median age of men at their first marriage in a certain community has steadily increased. If x represents the the median age of these men at their first marriage, then x can be approximated by the formula  + 24.1, where t represents the number of years since 1960. What is the median age of men who are married for the first time in 2003? Round to the nearest hundredth when appropriate.
A. 24.71 years B. 1062.53 years C. 50.33 years D. 1036.91 years
Divide and simplify.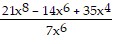
A. 3x2 - 2 + 
B. 3x2 - 2 + 
C. 3x - 2 + 
D. 3x - 2 + 
The graph of a function f is given. Use the graph to answer the question.What are the x-intercepts?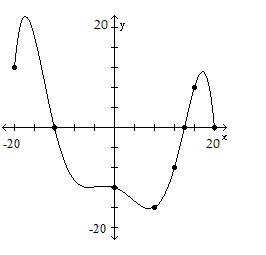
A. (-12, 0), (14, 0) B. (-12, 0), (14, 0), (20, 0) C. (-20, 0), (-12, 0), (14, 0), (20, 0) D. (-12, 0)