Which of the following physical situations would best be modeled by the graph?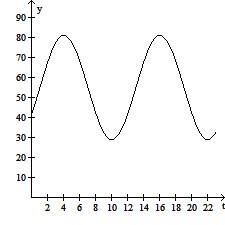
A. The monthly average ocean temperature y in degrees Fahrenheit during month t, where t = 1 corresponds to January.
B. The length y of a shadow cast by a horizontal flagpole on a vertical wall between sunrise and noon, where t is the angle shown.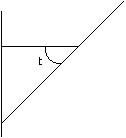
C. The number of hours y of sunlight during month t, where t = 1 corresponds to January.
D. The length y of a shadow cast by a tree between sunrise and noon, where t is the angle of elevation of the sun.
Answer: A
You might also like to view...
Use the vertex formula to find the vertex of the quadratic function.f(x) = -3x2 + 12x
A. 
B. 
C. 
D. 
Solve the problem.Consider a retirement savings account where the monthly contribution is $150 for the first 15 years, is increased to $225 for the next 15 years, and then is increased once again to $300 for the last 15 years. The APR is always 4.8% compounded monthly. What is the value of the account at the end of 45 years? Round your answer to the nearest cent.
A. $363,368.08 B. $366,146.09 C. $367,185.01 D. $369,963.02 E. $356,603.76
Use a percent equation to solve the percent problem.11 is what percent of 25?
A. 44% B. 0.44% C. 4.4% D. 4400%
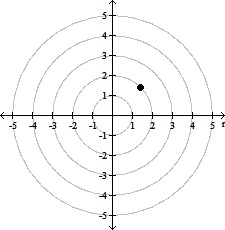
Plot the point given in polar coordinates.(5, 60°)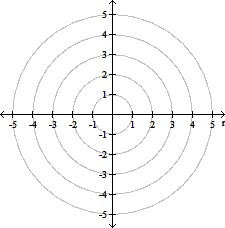
A. 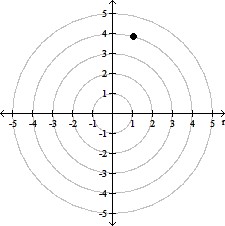
B. 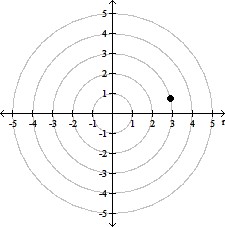
C. 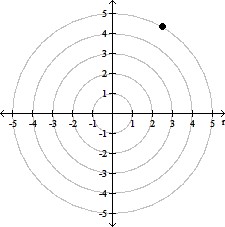
D.