These are the cost and revenue curves associated with a firm.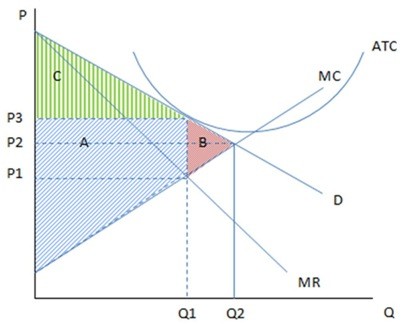 Assuming the firm in the graph shown is producing Q1 and charging P3, it is likely showing the cost and revenue curves of a monopolistically competitive firm that is:
A. earning zero economic profits.
B. earning positive economic profits.
C. It is impossible to tell from the graph provided.
D. earning negative economic profits.
Answer: A
You might also like to view...
Economists believe the most persuasive argument for protectionism is to protect infant industries. But the argument has a drawback. What is this drawback?
A) Governments are usually too impatient and do not allow protection to remain in place long enough to allow industries to be competitive in international markets. B) Protection lessens the need for firms to become productive enough to compete with foreign firms; this often results in infant industries never "growing up." C) Governments usually use tariffs, rather than quotas, to protect infant industries in order to collect tariff revenue. (Quotas do not result in government revenue). D) Governments always make the level of protection for infant industries too high.
Economic growth in China ________
A) would have been impossible in the absence of its impressive record of financial development B) occurred despite limited domestic financial development C) can continue indefinitely without additional financial development D) has occurred despite a relatively low domestic saving rate
Amusement Park / Cola Tie-in The Six Flags Over Texas amusement part in the middle of the Dallas-Fort Worth Metroplex has a tie-in marketing campaign with Coca-Cola during the summer. In local grocery stores, some Coke cans offer $5 off admission to the park. Why does Six Flags limit these cans so that none are sold further than 20 miles from the park?
The burden of the payroll tax falls entirely on the employee regardless of how it is formally divided between employer and employee if the
a. demand for labor is inelastic. b. supply of labor curve is horizontal. c. supply of labor curve is virtually vertical. d. demand for labor curve is elastic.