In the diagram, the economy's short-run AS curve is line ___ and its long-run AS curve is line ___.
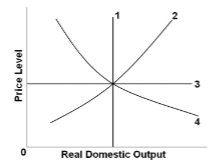
A. 1; 3
B. 2; 4
C. 3; 4
D. 2; 1
D. 2; 1
You might also like to view...
What is the key feature that differentiates business cycle theories?
A) whether the theory was developed before or after the Great Depression. B) whether the theory is Keynesian or non-Keynesian. C) whether the theory also explains economic growth. D) whether the theory explains how monetary policy works.
An explanatory forecasting technique in which the analyst must select independent variables that help determine the dependent variable is called
A) exponential smoothing. B) regression analysis. C) trend analysis. D) moving average method.
In the long run, if the Fed lowers the inflation rate and holds it at that new rate,
a. a zero inflation rate will be reached b. a recession will not occur c. inflationary expectations will fall d. the natural rate of unemployment will rise e. structural unemployment will start to decrease
A production possibilities curve graphically represents the maximum quantities of two products produced when all resources in the economy are efficiently utilized. An economy that operates inside this production possibilities curve
a. is using its resources inefficiently. b. lacks the necessary technology to produce efficiently. c. lacks the resources to produce goods efficiently. d. is utilizing its available resources as efficiently as possible.