Solve the problem.The following graph shows the private, public and total national school enrollment for students for select years from 1970 through 2000.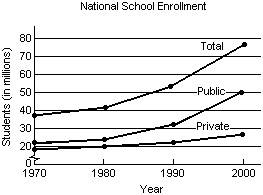 i) How is the graph for total school enrollment, T, determined from the graph of the private enrollment, r, and the public enrollment, u?ii) During which 10-year period did the total number of students enrolled increase the least?iii) During which 10-year period did the total number of students enrolled increase the most?
A.
| i) | T is the sum of r and u. |
iii) 1980-1990
B.
| i) | T is the difference of r and u. |
iii) 1990-2000
C.
| i) | T is the sum of r and u. |
iii) 1990-2000
D.
| i) | T is the sum of r and u. |
iii) 1970-1980
Answer: C
You might also like to view...
Solve the equation using the zero product property.x(3x + 8)(x - 1) = 0
A. 
B. 
C. 
D. 
Solve the equation on the interval 0 ? ? < 2?.cos2 ? - 1 = 0
A. 
B. {0, ?}
C. 
D. {0}
Solve.A company has 63,000 employees. Of these,  drive alone to work,
  car pool,
  use public transportation,
  cycle, and the remainder use other methods of transportation. How many employees use each method of transportation?
A. Drive alone: 2,100; car pool: 10,500; public transportation: 9,000; cycle: 7,000; 
B. Drive alone: 21,000; car pool: 10,500; public transportation: 9,000; cycle: 7,000; 
C. Drive alone: 21,100; car pool: 10,500; public transportation: 8,900; cycle: 7,000; other: 1000
D. Drive alone: 21,000; car pool: 10,500; public transportation: 9,000; cycle: 7,000; 
Assume that 80% of all children who are exposed to chicken pox contract the disease. If 1225 children are exposed to chicken pox, the probability that more than 945 of them will contract the disease is approximately the area under the standard normal curve
A. to the right -2.46. B. to the right of -2.50. C. to the right -0.18. D. to the left 2.46. E. none of these