Refer to the information provided in Figure 2.5 below to answer the question(s) that follow.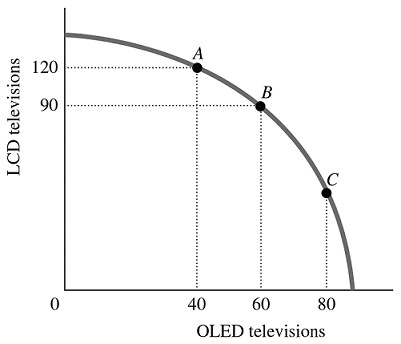 Figure 2.5Refer to Figure 2.5. The best point for society would be
A. either Point B or Point C, as the total amount being produced at either of these points is approximately the same.
B. at any of the labeled points, as all of the points represent an efficient allocation of resources.
C. Point C, as at this point there are approximately equal amounts of LCD and OLED televisions being produced.
D. indeterminate from this information, as we don't have any information about the society's desires.
Answer: D
You might also like to view...
The supply curve for land is perfectly elastic
a. True b. False Indicate whether the statement is true or false
Historical note: During the 1970s, when the aggregate supply curve shifted to the left, the result was
a. cost-push inflation and demand-pull inflation b. demand-pull inflation c. cost-push inflation and greater employment d. stagflation e. deflation
For real-world economies, the Gini coefficient lies between
a. 1 and 10 b. 0 and 100 c. 0 and 1 d. –1 and +1 e. 0 and infinity
Which of the following events would increase the four-firm concentration ratio in a milk industry with six firms?
A. The two largest milk producers merge. B. The largest milk producer buys an ice cream-making plant. C. The largest milk producer lures customers away from the second largest producer. D. The four largest milk producers collusively fix prices.