This graph depicts a tax being imposed, causing demand to shift from D1 to D2. The amount of the tax imposed in the graph shown is equal to:
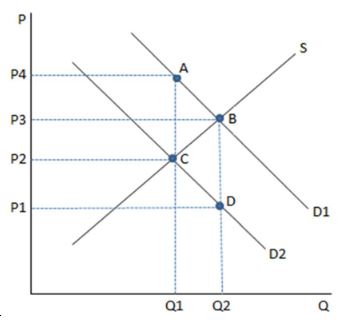
A. (P1 P3).
B. (P2 P1).
C. (P4 P2).
D. (P4 P3).
C. (P4 P2).
You might also like to view...
Which of the following empirical studies cast the most doubt on the Heckscher-Ohlin model?
A) the study by Wassily Leontief B) the study by Bowen, Leamer, and Sveikauskas C) the study by David Ricardo D) the study by Adam Smith E) the study by Davis and Weinstein
A horizontal LM curve implies that the expenditure multiplier, when compared with the simple Keynesian expenditure multiplier, is
A) smaller. B) larger. C) equal. D) equal to the inverse of the simple multiplier.
Which was not one of the main U.S. land acquisitions?
a. The Oregon Country b. The Texas Annexation c. The Florida Acquisition d. The Gadsden Purchase e. All of the above are U.S. land acquisitions.
How was South Korea able to use infant industry protection successfully to start its car companies, when many countries experience negative results when they use infant industry protection?
a. The protection has never stopped. b. The protection was so small it had no effect on the car companies. c. The protection had a definite end, whether the infant industry grew or did not grow. d. The protection had a large enough subsidy to make companies’ profitable.