Refer to the information provided in Figure 5.7 below to answer the question(s) that follow.
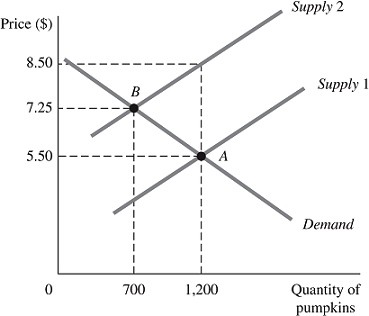 Figure 5.7The above figure represents the market for pumpkins both before and after the imposition of an excise tax, which is represented by the shift of the supply curve.Refer to Figure 5.7. The amount the store owners will receive per pumpkin after paying the tax is
A. $1.75.
B. $3.00.
C. $4.25.
D. $7.25.
Answer: C
You might also like to view...
The quantity of labor demanded depends on the
A) money wage rate not the real wage rate. B) real wage rate not the money wage rate. C) price of output not the money wage rate nor the real wage rate. D) money wage rate AND the real wage rate.
The force that leads to zero economic profits for monopolistically competitive firms in the long run is
a. excess capacity. b. price wars among firms. c. entry by new firms. d. excessive advertising.
Use the following graph to answer the next question.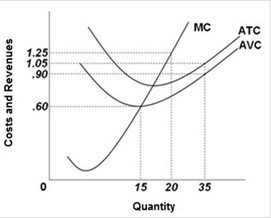 The graph shows the cost curves for a perfectly competitive firm. If the market price of the product is $1.25 per unit,then the firm will earn how much in profits/losses in the short run?
A. $25 B. $9 C. -$9 D. -$12
A study of the per capita consumption of gasoline: in 10 countries demonstrates that:
A. the consumption of gasoline does not appear to be related to the price of gasoline. B. higher gasoline prices reduce consumption in some of those countries, but not in others. C. higher gasoline prices do result in lower consumption of gasoline. D. higher gasoline prices actually increase the consumption of gasoline.