Refer to Figure 8.1. Which graph best represents a total cost function?
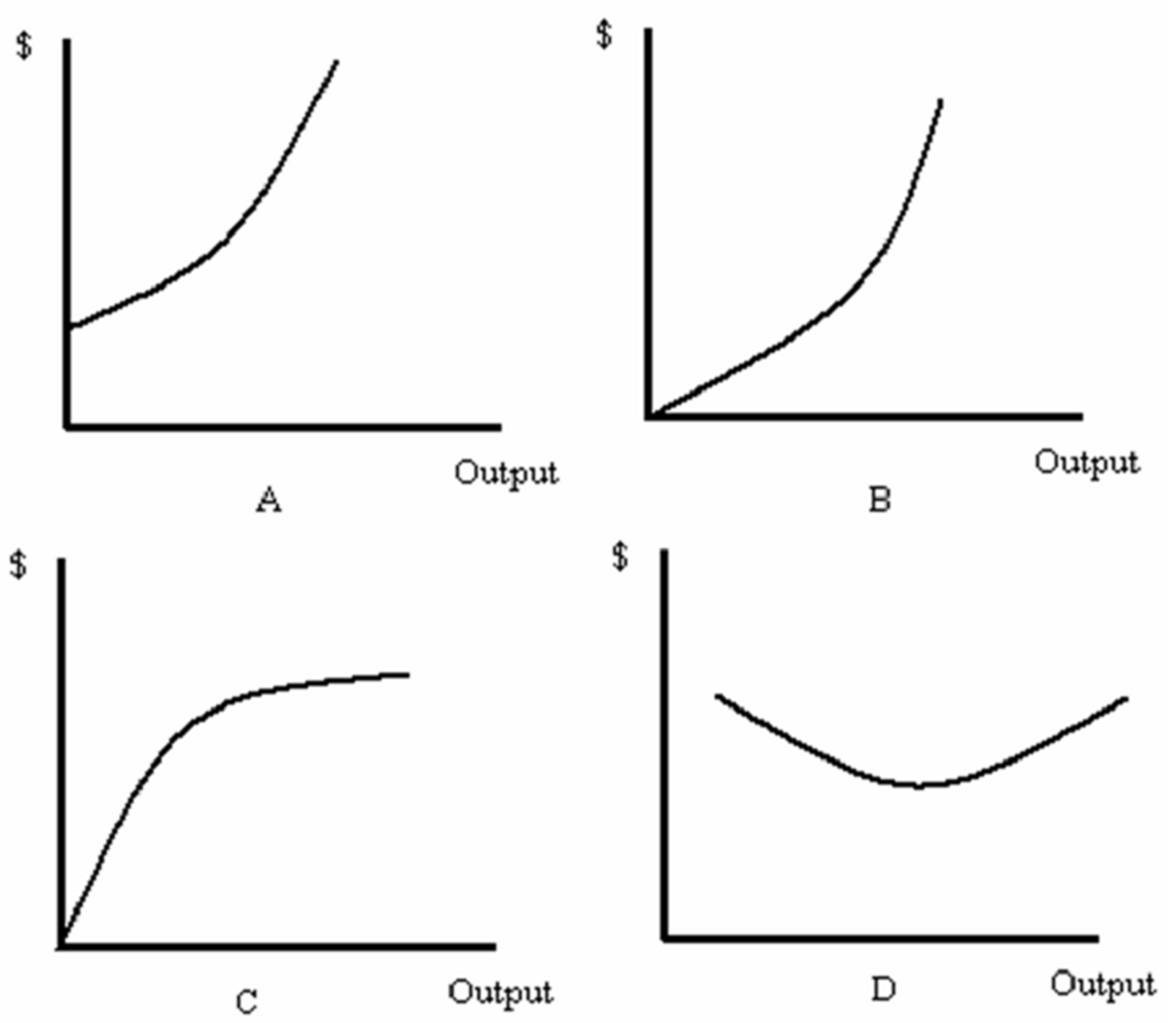
A. A
B. B
C. C
D. D
A. A
You might also like to view...
The above table depicts output from a firm that manufactures computers. The computers sell for $1,000 each. What is the marginal revenue product (MRP) for the fourteenth worker per week?
A) 90 units B) 80 units C) $70,000 D) $60,000
What is the equilibrium wage and level of employment under monopsony?
a. W1 and E1 b. W2 and E0 c. W0 and E0 d. W0 and E1 e. W0 and E2
Answer the following statement(s) true (T) or false (F)
1. Proposals have been submitted to phase down HFCs, a CFC substitute, because they are greenhouse gases contributing to climate change. 2. The “greenhouse effect” is a natural phenomenon. 3. Climate change and global warming are exactly the same phenomenon. 4. Oceans and forests act as natural carbon sinks, which can absorb the anthropogenic releases of CO2. 5. Scientific evidence supports the assertion that human activity is adding to the accumulation of greenhouse gases and therefore contributing to global warming.
Timber producers destroy many acres of rainforests every year. To prevent deforestation, the government imposed a quota on the number of trees that were cut by the timber producers. The quota was imposed by the government to prevent _____
a. the free rider problem b. the tragedy of the commons c. asymmetric information d. deadweight loss