Provide an appropriate response.Which of the following would be best used to demonstrate sales trends:
A. circle graph
B. bar graph
C. frequency distribution
D. line graph
Answer: D
Mathematics
You might also like to view...
Find r(t) satisfying the conditions for  Figure 3.png)
 multiple choice.png)
Mathematics
The number of television sets that consumers buy depends on price. The higher the price, the fewer TVs people will buy. The equation that relates price to the number of TVs sold at that price is called a demand equation. If the demand equation for a 13-inch TV is 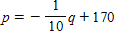 , where p is the price and q is the number of TVs sold at that price, how many TVs will be sold at a price of $159?
?
Enter the number without the units.
, where p is the price and q is the number of TVs sold at that price, how many TVs will be sold at a price of $159?
?
Enter the number without the units.
Fill in the blank(s) with the appropriate word(s).
Mathematics
Use the following information to fill in the blank: 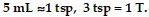 21 mL = ___ T
A. 1.4 B. 315 C. 105 D. 4.2
Mathematics
Find the integral.
A. 2e4z + C
B.  e4z + C
C. 4e4z + C
D.  e4z + C
Mathematics