What Excel feature would you use to compute and display an average of the data values in your chart?
A. Quick Analysis tool
B. Data Tables tool
C. Data Analysis tool
D. Chart Elements tool
Answer: A
You might also like to view...
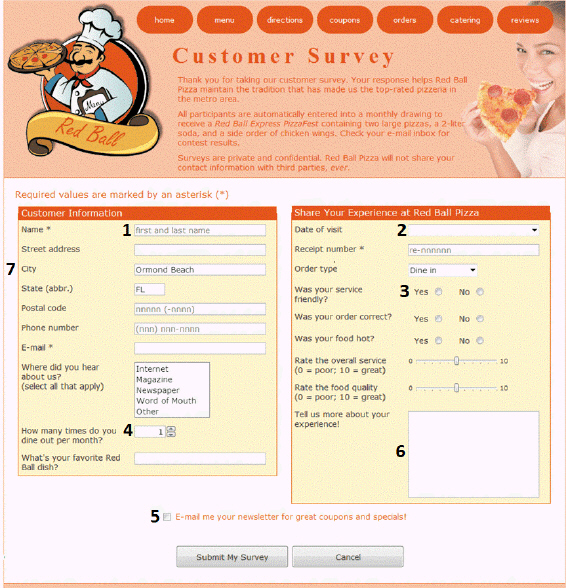 The item marked 4 in the accompanying figure is a(n) ____ button.
A. report B. reset C. option D. spinner control
A set procedure, called the order of calculations, determines the order in which operations in a formula with multiple operators will be evaluated
Indicate whether the statement is true or false
?Which of the following is a guideline for preparing an effective slide presentation?
A. ?Use numbers rather than bullets, unless showing a specific sequence. B. ?Display at least three topics per slide. C. ?Use appropriate point sizes for titles and body text. D. ?Read the slides to the audience during the presentation.
A device whose design employs duplication of failure-prone components so as to ensure the greatest possible availability is known as:
a. Optimized b. Redundant c. Highly available d. Fault tolerant