According to the data in the table, the inflation rate for 1996 was
Consider the following data from the Economic Report of the President.
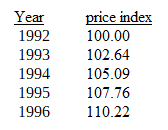
a) 10.22 %
b) 2.28 %
c) 2.46 %
d) 1.1022 %
e) 11.022 %
b) 2.28 %
You might also like to view...
Regulated firms can be induced to tell the truth
Indicate whether the statement is true or false
In the short run, which of the following is FALSE about the shutdown point?
A) Total revenue is equal to total fixed cost. B) Total revenue is equal to total variable cost. C) Product price is equal to the minimum average variable cost. D) Price multiplied by quantity must be equal to minimum average variable cost multiplied by quantity.
The majority of export in the U.S. come from:
A. consumption goods and automotive vehicles. B. capital goods and industrial supplies. C. capital goods and consumption goods. D. industrial goods and consumption goods.
Figure 10-4
?
 In Figure 10-4, if full employment occurs at 5,000 and the price level is currently 130, then we can expect the
A. aggregate supply curve to shift to the left until a new equilibrium is established at an output level of 4,000. B. aggregate demand curve to shift to the right until a new equilibrium is established at an output level of 6,000. C. price level to fall to 110. D. aggregate demand to shift to the left and aggregate supply to shift to the right until the price level reaches 130.