Construct a pie chart illustrating the given data set.A cereal manufacturer wants to introduce their new cereal breakfast bar. The marketing team traveled to various states and asked 900 people to sample the breakfast bar and rate it as excellent, good, or fair. The following data give the rating distribution.ExcellentGoodFair180450270 
A. 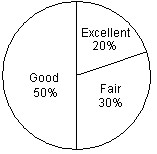
B. 
C. 
D. 
E. 
Answer: A
You might also like to view...
Use least common multiple or greatest common divisor to solve the problem.Rob can complete his bus route in 6 hours. Joan can complete her bus route in 3 hours. If they both left the terminal at 3:00 am and after each completed route returned to the terminal, determine the next time they would leave the terminal at the same time.
A. 6:00 am B. 9:00 am C. 12:00 pm D. Not enough information given to tell
Find the vertex, focus, and directrix of the parabola. Graph the equation.(y + 1)2 = -8(x + 2)
A. vertex: (1, 2)
focus: (-1, 2)
directrix: x = 3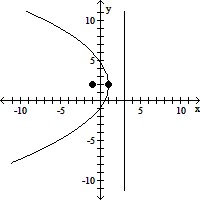
B. vertex: (-2, -1)
focus: (-2, -3)
directrix: y = 1
C. vertex: (2, 1)
focus: (2, -1)
directrix: y = 3
D. vertex: (-2, -1)
focus: (-4, -1)
directrix: x = 0
Determine whether matrix B is the inverse of matrix A by finding the product AB.A =  , B =
, B = 
A. B = A-1 B. B ? A-1
Find the distance between P and Q.P(-3, -4), Q(6, -7)
A. 3
B. 12
C. 72
D. 72