Of the collection of supply and demand diagrams in Figure 2.2, which one shows the result of an increase in the population of the group of people likely to buy a good?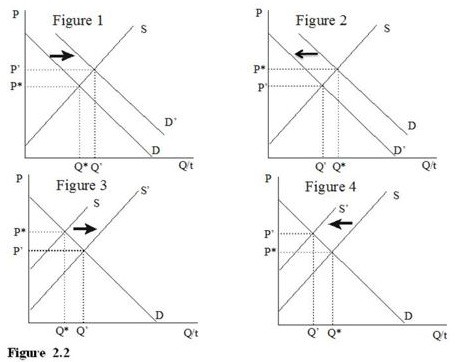
A. Figure 1
B. Figure 2
C. Figure 3
D. Figure 4
Answer: A
You might also like to view...
If property rights are not clearly defined and enforced, then
A) incentives for specialization based on comparative advantage are weakened. B) some potential gains from specialization and trade are lost. C) resources are devoted to protecting possessions rather than to production. D) All of the above answers are correct.
Which of the following goods will have the most elastic demand at any time?
A. Coffee B. Gasoline C. Restaurant meals D. Insulin
Answer the question on the basis of the following national income data for the economy. All figures are in billions of dollars. Personal Consumption Expenditures 400 Government Purchases 128 Gross Private Domestic Investment 88 Net Exports 7 Net Foreign Factor Income 0 Consumption of Fixed Capital 43 Taxes on Production and Imports 50 Compensation of Employees 369 Rents 12 Interests 15 Proprietor's Income 52 Corporate Income Taxes 36 Dividends 24 Undistributed Corporate Profits 22 Statistical Discrepancy 0 Refer to the above data. Net domestic product is:
a) $520. b) $580. c) $623. d) $573.
The major objective of Medicaid is to:
A. provide health care services to the aged. B. provide health care services to those receiving public assistance. C. contain rising health care costs. D. make a basic health care package available to all Americans.