Refer to the graph below.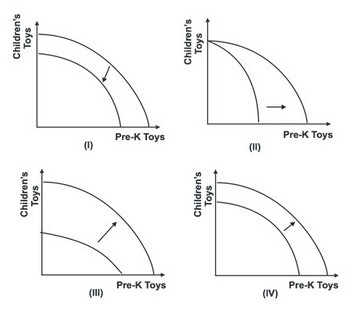 Which of the shifts explains what would happen to the production possibility curve if improved technologies increased the production of prekindergarten (Pre-K) toys by 25 percent and the production of children's toys by 50 percent?
A. I
B. II
C. III
D. IV
Answer: C
You might also like to view...
According to the profit-maximization goal, the firm should attempt to maximize short-run profits since there is too much uncertainty associated with long-run profits
a. true b. false
If planned construction investment increases by $30 billion and the MPC is two-thirds, total output will increase by
a. $30 billion. b. $20 billion. c. $45 billion. d. $90 billion.
Which of the following results if at a particular price level, the aggregate quantity supplied exceeds the aggregate quantity demanded?
A. Aggregate demand shifts to the right. B. A surplus causes the price level to fall. C. Aggregate supply shifts to the left. D. A surplus causes the price level to rise.
"Supply creates its own demand" implies that
A. the very act of supplying a particular level of goods and services will not necessarily equal the level of goods and services demanded. B. the government will buy up any surplus of goods and services in a country to avoid economic problems. C. the very act of demanding a particular level of goods and services necessarily equals the level of goods and services supplied. D. the very act of supplying a particular level of goods and services necessarily equals the level of goods and services demanded.