Refer to the double-bar graph below which shows the number of male (M) and female (F) athletes at a university over a four-year period. Solve the problem. 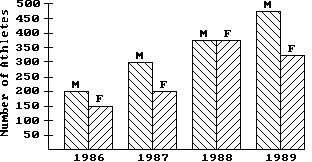 YEARWould it be fair to conclude from the graph that the university's athletics program expanded over the four years? Explain.
A. No; Female athletes almost always numbered less than male athletes.
B. Yes; The number of male and female athletes increased in general over the four years.
Answer: B
Mathematics
You might also like to view...
Identify the property that allows you to conclude that the triangles are congruent. Or, if such a conclusion cannot be made, answer "None."
A. ASA B. SSS C. SAS D. None
Mathematics
Provide an appropriate response.The probability distribution for the random variable X is: 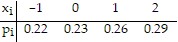 What is the expected value of X?
A. 0.62 B. 0.26 C. 0.22 D. 0.50
Mathematics
Subtract and, if possible, simplify. -
- 
A. 
B. 
C. 
D. 
Mathematics
Simplify.5log5 x
A. 5x
B. -x
C. 
D. x
Mathematics