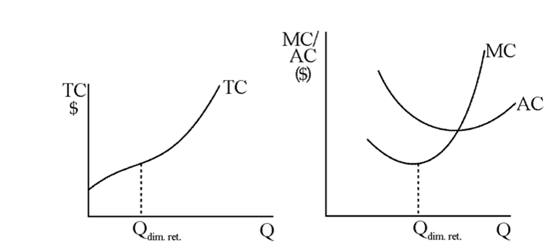
Graph typical total, average, and marginal cost curves and explain how their shapes are influenced by the law of diminishing returns. Graph TC on a separate graph, AC and MC on a second graph.
What will be an ideal response?
Figure 7-19
You might also like to view...
If the monopoly illustrated in the figure above could engage in perfect price discrimination, then when it maximizes its profit the total revenue collected by the firm would be
A) $110. B) $120. C) $210. D) $310.
Unemployment is referred to as a lagging indicator because
A) it tends to stay high for many months after output stops declining during a recession. B) reports on unemployment statistics tend to lag behind reports on inflation statistics. C) it takes time to collect information regarding unemployed individuals.. D) it indicates economic activities from the year before.
Which of the following is downward-sloping?
a. both the long-run Phillips curve and the short-run Phillips curve b. neither the long-run Phillips curve nor the short-run Phillips curve c. the long-run Phillips curve, but not the short-run Phillips curve d. the short-run Phillips curve, but not the long-run Phillips curve
If inflation was 3 percent last year and 2 percent this year, an individual who follows extrapolative expectations would predict that the inflation rate for the coming year would be:
A. 1 percent. B. 0 percent. C. 3 percent. D. 5 percent.