In Figure G-2, which of the maps has the largest scale?
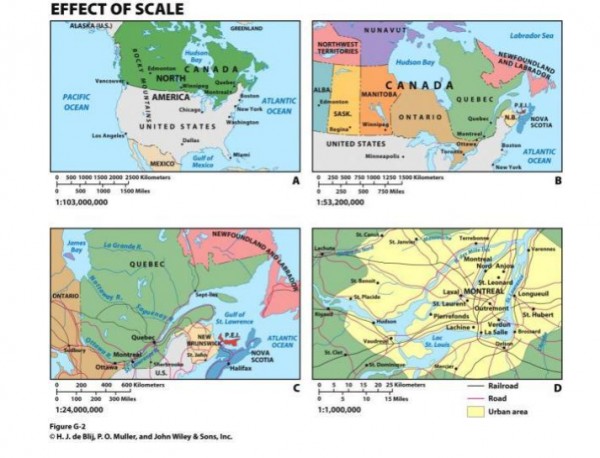
a) Map A
b) Map B
c) Map C
d) Map D
e) They all have the same scale.
You might also like to view...
In the above figure, Jill's opportunity cost of producing 1 gallon of bottled water is ________ of soda
A) 4 gallons B) 1/4 of a gallon C) 1 gallon D) 1/2 of a gallon E) 2 gallons
Sequential games are used to analyze
A) second-price auctions. B) cartels. C) situations in which one firm acts and other firms respond. D) firms that are subject to the prisoner's dilemma.
Excess reserves are
What will be an ideal response?
Refer to the diagram in which S is the market supply curve and S 1 is a supply curve comprising all costs of production, including external costs. Assume that the number of people affected by these external costs is large. Without government
interference, this market will reach:
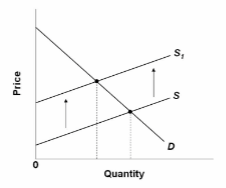
A. an optimal allocation of society's resources.
B. an underallocation of resources to this product.
C. an overallocation of resources to this product.
D. a higher price than is consistent with an optimal allocation of resources.