List all of the errors in Figure 1.1.
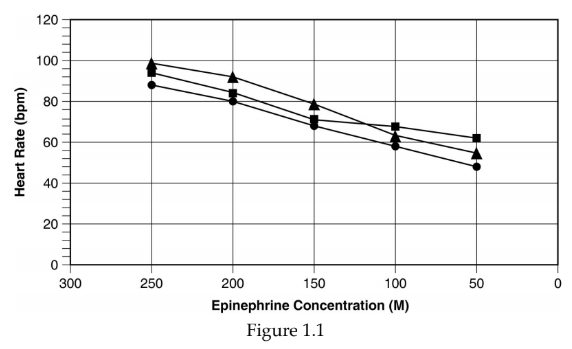
1. The units of concentration are labeled as M when they should be mg.
2. The x-axis is in decreasing order of concentration.
3. The graph needs a legend.
4. The data for each concentration of epinephrine should be averaged and plotted as a single trend.
Anatomy & Physiology
You might also like to view...
The actions of thyroxine ________ the production of metabolic heat.
A. increase B. have no effect on C. decrease
Anatomy & Physiology
How many bones are in the appendicular skeleton?
A) 60 B) 80 C) 100 D) 120 E) 126
Anatomy & Physiology
A place where two or more bones come together is a(n)
A. cavity. B. joint. C. contusion. D. articulation. E. joint and an articulation.
Anatomy & Physiology
Cause of albumin (albuminuria)
What will be an ideal response?
Anatomy & Physiology