Figure 11-3
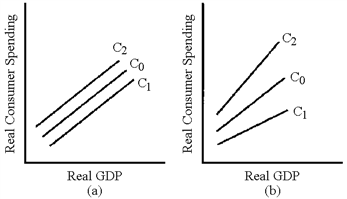
In Figure 11-3, which line represents the change in the consumption schedule caused by an increase in the personal income tax?
a.
C1 in graph (a)
b.
C2 in graph (a)
c.
C1 in graph (b)
d.
C2 in graph (b)
c
You might also like to view...
A firm in a competitive price-searcher market can raise its price without losing all of its customers. This is a result of
a. low entry barriers. b. a perfectly elastic market demand. c. the small number of firms in the market. d. product differentiation.
The property that rules out indifference curves that cross is:
A. independence. B. completeness. C. diminishing marginal rate of substitution. D. transitivity.
If a 1% change in price leads to a 2% change in quantity demanded, then the elasticity of demand is
A. 0.5. B. 1.0. C. 1.5. D. 2.0.
Refer to the diagram. The most likely cause of a shift from AB to CD would be a(n):
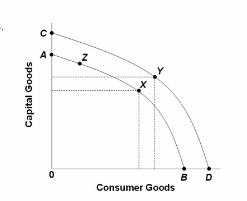
A. increase in productivity.
B. increase in the price level.
C. decrease in the size of the labor force.
D. recession.