The following graph resulted when a researcher plotted the paired scores from two sets of data:
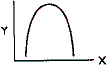
Which of the following conclusions is justified from an examination of the graph?
a. The coefficient of correlation is close to .50.
b. The correlation between X and Y is negative and low.
c. The correlation between X and Y is positive and high.
d. A Spearman rho coefficient of correlation is appropriate for these data. e.
A Pearson’s coefficient of correlation is not appropriate for these data.
E
You might also like to view...
What conclusions have been reached by psychologists who have reviewed research on the effectiveness of using objectives?
What will be an ideal response?
During the early childhood years, the child's __________________ is/are marked by a lack of coordination between the two functional constants of intelligence: assimilation and accommodation
Fill in the blank(s) with correct word
Breathing occurs as a result of:
a. Unequal air pressure b. The act of breathing forcing the lungs to expand c. The voluntary movement of rib bones d. The lack of movement of the diaphragm muscle
What is the primary goal of service-learning?
a. To dedicate more time to studying b. To collaborate with successful people c. To make new scientific discoveries d. To learn while giving back to the community