The following double-bar graph illustrates the revenue for a company for the four quarters of the year for two different years. Use the graph to answer the question.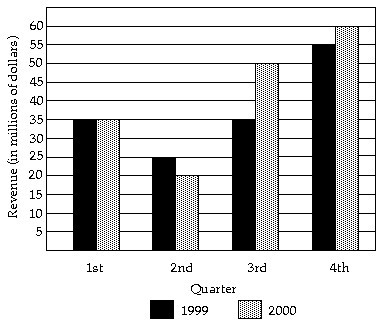 How much more revenue did the company take in for the fourth quarter of 2000 than the first quarter of 2000?
A. $4 million
B. $20 million
C. $5 million
D. $25 million
Answer: D
You might also like to view...
Solve the problem.A charged particle of mass m and charge q moving in an electric field E has an acceleration a given by  where q and E are constants. Find
  .
.
A.  = -
= - 
B.  = -
= - 
C.  = qEm
= qEm
D.  =
= 
Find the number of ways to get the following card combinations from a 52-card deck.If three cards are successively dealt from a 52-card deck without replacement, in how many ways could they be a face card, then a spade, and then a heart?
A. 1,248 ways B. 1,862 ways C. 936 ways D. 1,950 ways
Classify the angle as acute, right, obtuse, or straight.
A. obtuse B. right C. straight D. acute
Solve.A worker has readings that take  minute each to read and record. How many readings can be completed in 54 minutes?
A. 81 readings B. 55 readings C. 20 readings D. 36 readings