The figure below depicts the short-run market equilibrium in a perfectly competitive market and the cost curves for a representative firm in that market. Assume that all firms in this market have identical cost curves.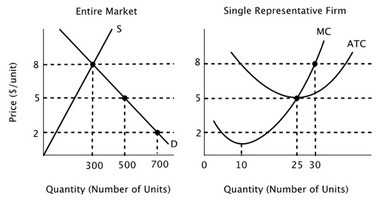 The long-run market equilibrium quantity in this industry is:
A. 500.
B. more than 700.
C. 700.
D. 300.
Answer: A
You might also like to view...
To find the percentage change in price,
A. The change in quantity is divided by the average quantity. B. The change in quantity is divided by the change in price. C. The percentage change in quantity demanded is divided by the percentage change in price. D. The change in price is divided by the average price.
A large increase in the supply of HD-TV sets occurs simultaneously with a smaller decrease in its demand. As a result the equilibrium price will:
A. Increase and the equilibrium quantity will decrease B. Increase and the equilibrium quantity will increase C. Decrease and the equilibrium quantity will decrease D. Decrease and the equilibrium quantity will increase
If the marginal product of labor is less than the average product of labor, then the
A. marginal product must be increasing. B. marginal product must be decreasing. C. average product must be decreasing. D. Both B and C
Refer to the below table. The resource demand data indicate that the firm is:
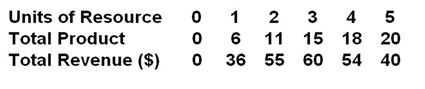
A. Buying its resource in an imperfectly competitive market
B. Buying its resource in a perfectly competitive market
C. Selling its product in a perfectly competitive market
D. Selling its product in an imperfectly competitive market