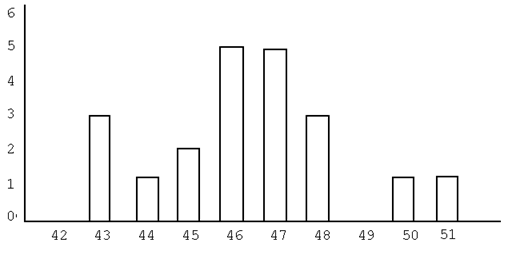
Construct a histogram form the data shown.
What will be an ideal response?
Mathematics
You might also like to view...
Sketch a possible graph of f(x) using f'(x).f'(x) = x2(x - 1)(x - 3) and f(0) = 1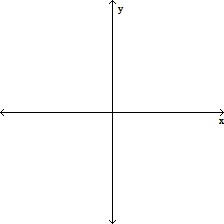
A. 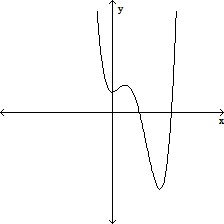
B. 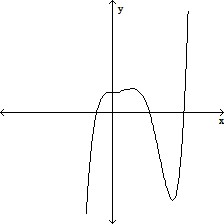
C. 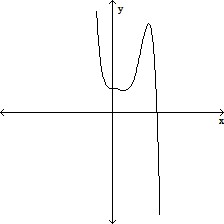
D. 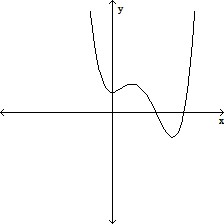
Mathematics
Solve each proportion for the given variable. =
= 
A. -12
B. -3
C. 24
D. -96
Mathematics
Describe the given set of points with a single equation or with a pair of equations.The set of points equidistant from the points (0, 0, -9) and (0, 0, -9)
A. x + y = -9 B. z > -9 and z < -9 C. z = -9 D. x + y = 0 and -9 < z < -9
Mathematics
Solve and graph.x < 4 or x < 7![]()
A. (-?, 7)![]()
B. (4, ?)![]()
C. (4, 7)![]()
D. (-?, 4) ? (7, ?)![]()
Mathematics