Solve the problem.The table shows the population of a certain city for selected years between 1950 and 2003. 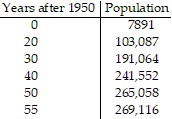 Use the logistic regression function on your calculator to determine the logistic equation that best fits the data.
A. P = 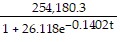
B. P = 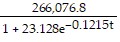
C. P = 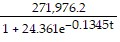
D. P = 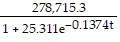
Answer: C
Mathematics
You might also like to view...
?What is not true about polyhedra and three-dimensional figures? ?
A. ?All polyhedra are three-dimensional figures. B. ?All three-dimensional figures are polyhedra. C. ?All rectangular prisms are polyhedra. D. ?A cone is a three-dimensional figure. E. ?A polyhedra has polygon faces.
Mathematics
Evaluate the expression.(-2)0
A. 0 B. 1 C. -2 D. -1
Mathematics
Perform the operation and reduce to lowest terms.1 × 4 ×
× 4 × 
A. 5
B. 4
C. 42
D. 2
Mathematics
Plot the point.(3, 5)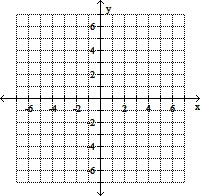
A. 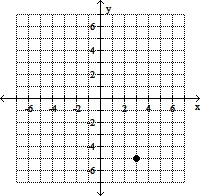
B. 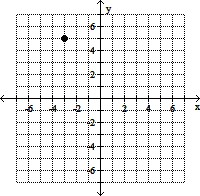
C. 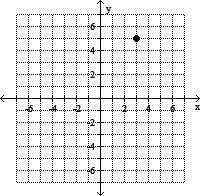
D. 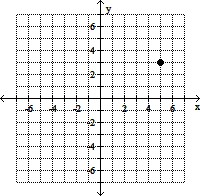
Mathematics