Refer to Figure 5-5. If, because of an externality, the economically efficient output is Q2 and not the current equilibrium output of Q1, what does D2 represent?
A) the demand curve reflecting the sum of social and external benefits
B) the demand curve reflecting social benefits
C) the demand curve reflecting private benefits
D) the demand curve reflecting external benefits
B
You might also like to view...
Always there wireless is wireless monopolist in a rural area. There are 200 customers, each of whom has a monthly demand curve for wireless minutes of Qd = 200 - 100P, where P is the per-minute price in dollars and Q is the number of wireless minutes. The marginal cost of providing the wireless service is $0.25 per minute. If Always There charges $0.50 per minute, how large of a fixed monthly fee can it charge and still persuade customers to buy their service?
A. $200 B. $150 C. $225 D. $112.50
An industry that can expand or contract without affecting the long-run per unit cost of production is:
a. decreasing cost industry b. increasing cost industry c. constant cost industry d. productive efficiency industry
In the early 2000s the European Central Bank warned that higher oil prices were a threat to economic growth. The Bank President called the higher prices "a sizeable adverse shock" to the economy. In terms of the AS/AD framework, this shock would be represented as a shift:
A. right of the AD curve. B. down (to the right) of the AS curve. C. up (to the left) of the AS curve. D. left of the AD curve.
Refer to the information provided in Figure 5.3 below to answer the question(s) that follow.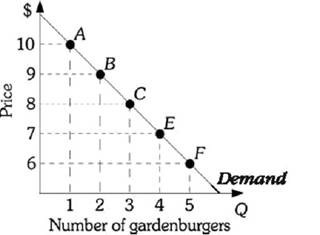 Figure 5.3Refer to Figure 5.3. Use the midpoint formula. If the price of a gardenburger increases from $6 to $8, the price elasticity of demand equals ________ and demand is ________.
A. -2.0; elastic B. -1.75; elastic C. -0.57; inelastic D. -1.9; inelastic