Which of the diagrams illustrate(s) the effect of a decrease in incomes on the market for secondhand clothing?
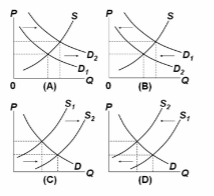
A. A and C.
B. A only.
C. B only.
D. C only.
B. A only.
You might also like to view...
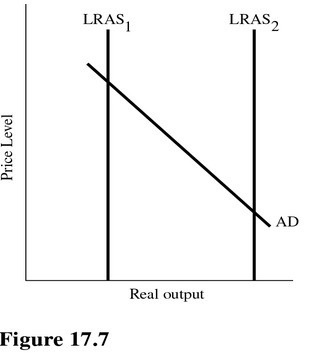 According to Figure 17.7, a shift in the long-run aggregate supply from LRAS1 to LRAS2 would most likely result from
A. An increase in the money supply. B. A decrease in transfer payments. C. An increase in labor skills. D. An increase in government spending.
Given the strict quantity theory of money, if the quantity of money doubled, prices would:
A. fall by half. B. double. C. remain constant. D. increase somewhat but less than double.
The area above the market supply curve and below the market price
A) is equal to the total amount of producer surplus in a market. B) is equal to the marginal cost of the last unit produced. C) is equal to the total amount of economic surplus in a market. D) is equal to the total cost of production.
The "statistical discrepancy" that the NIPA includes in the data is to account for the following, except:
A. To equalize GDP totals produced by the expenditures approach and the income approach B. Errors due to people misrepresenting their incomes on their tax returns C. Difficulty in accurately estimating depreciation D. Household production, or "do-it-yourself" activities of households