Use the following graph to answer the next question.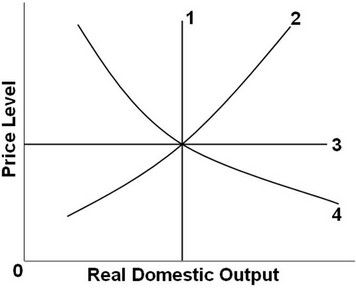 In the diagram, the economy's relevant aggregate demand and long-run aggregate supply curves, respectively, are lines ________.
A. 2 and 4
B. 4 and 1
C. 4 and 2
D. 2 and 3
Answer: B
You might also like to view...
Game theory is the study of ________
A) policy analysis B) strategic interactions C) program evaluation D) irrational decision making
How is offshoring of services different from past trade patterns?
What will be an ideal response?
All of the following are components of aggregate demand EXCEPT
A) consumption spending. B) government purchases. C) the level of technology. D) net foreign spending on domestic production.
A look at the historical data indicates that velocity for M1
a. has been more variable than the velocity for M2, but both have been fairly constant for the past 65 years. b. and M2 have both trended downward, but velocity for M2 has been more erratic than velocity for M11. c. has been fairly constant for the past 65 years, but velocity for M2 has trended downward. d. has trended upward in the past 65 years, but velocity for M2 has been more constant.