You would use either a ______ to illustrate the data in this frequency distribution table.
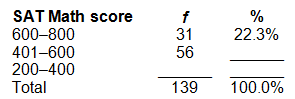
a. pie graph or frequency polygon
b. bar chart or pie graph
c. histogram or frequency polygon
d. bar chart or histogram
c. histogram or frequency polygon
You might also like to view...
Convergers typically:
a. lack problem-solving skills b. learn by testing theories c. take a while to get to the point d. prefer doing things in a different way each time whenever possible
Calculate the expected frequency (fe) for those who believe the police do not do a good job and are somewhat afraid to walk after dark.
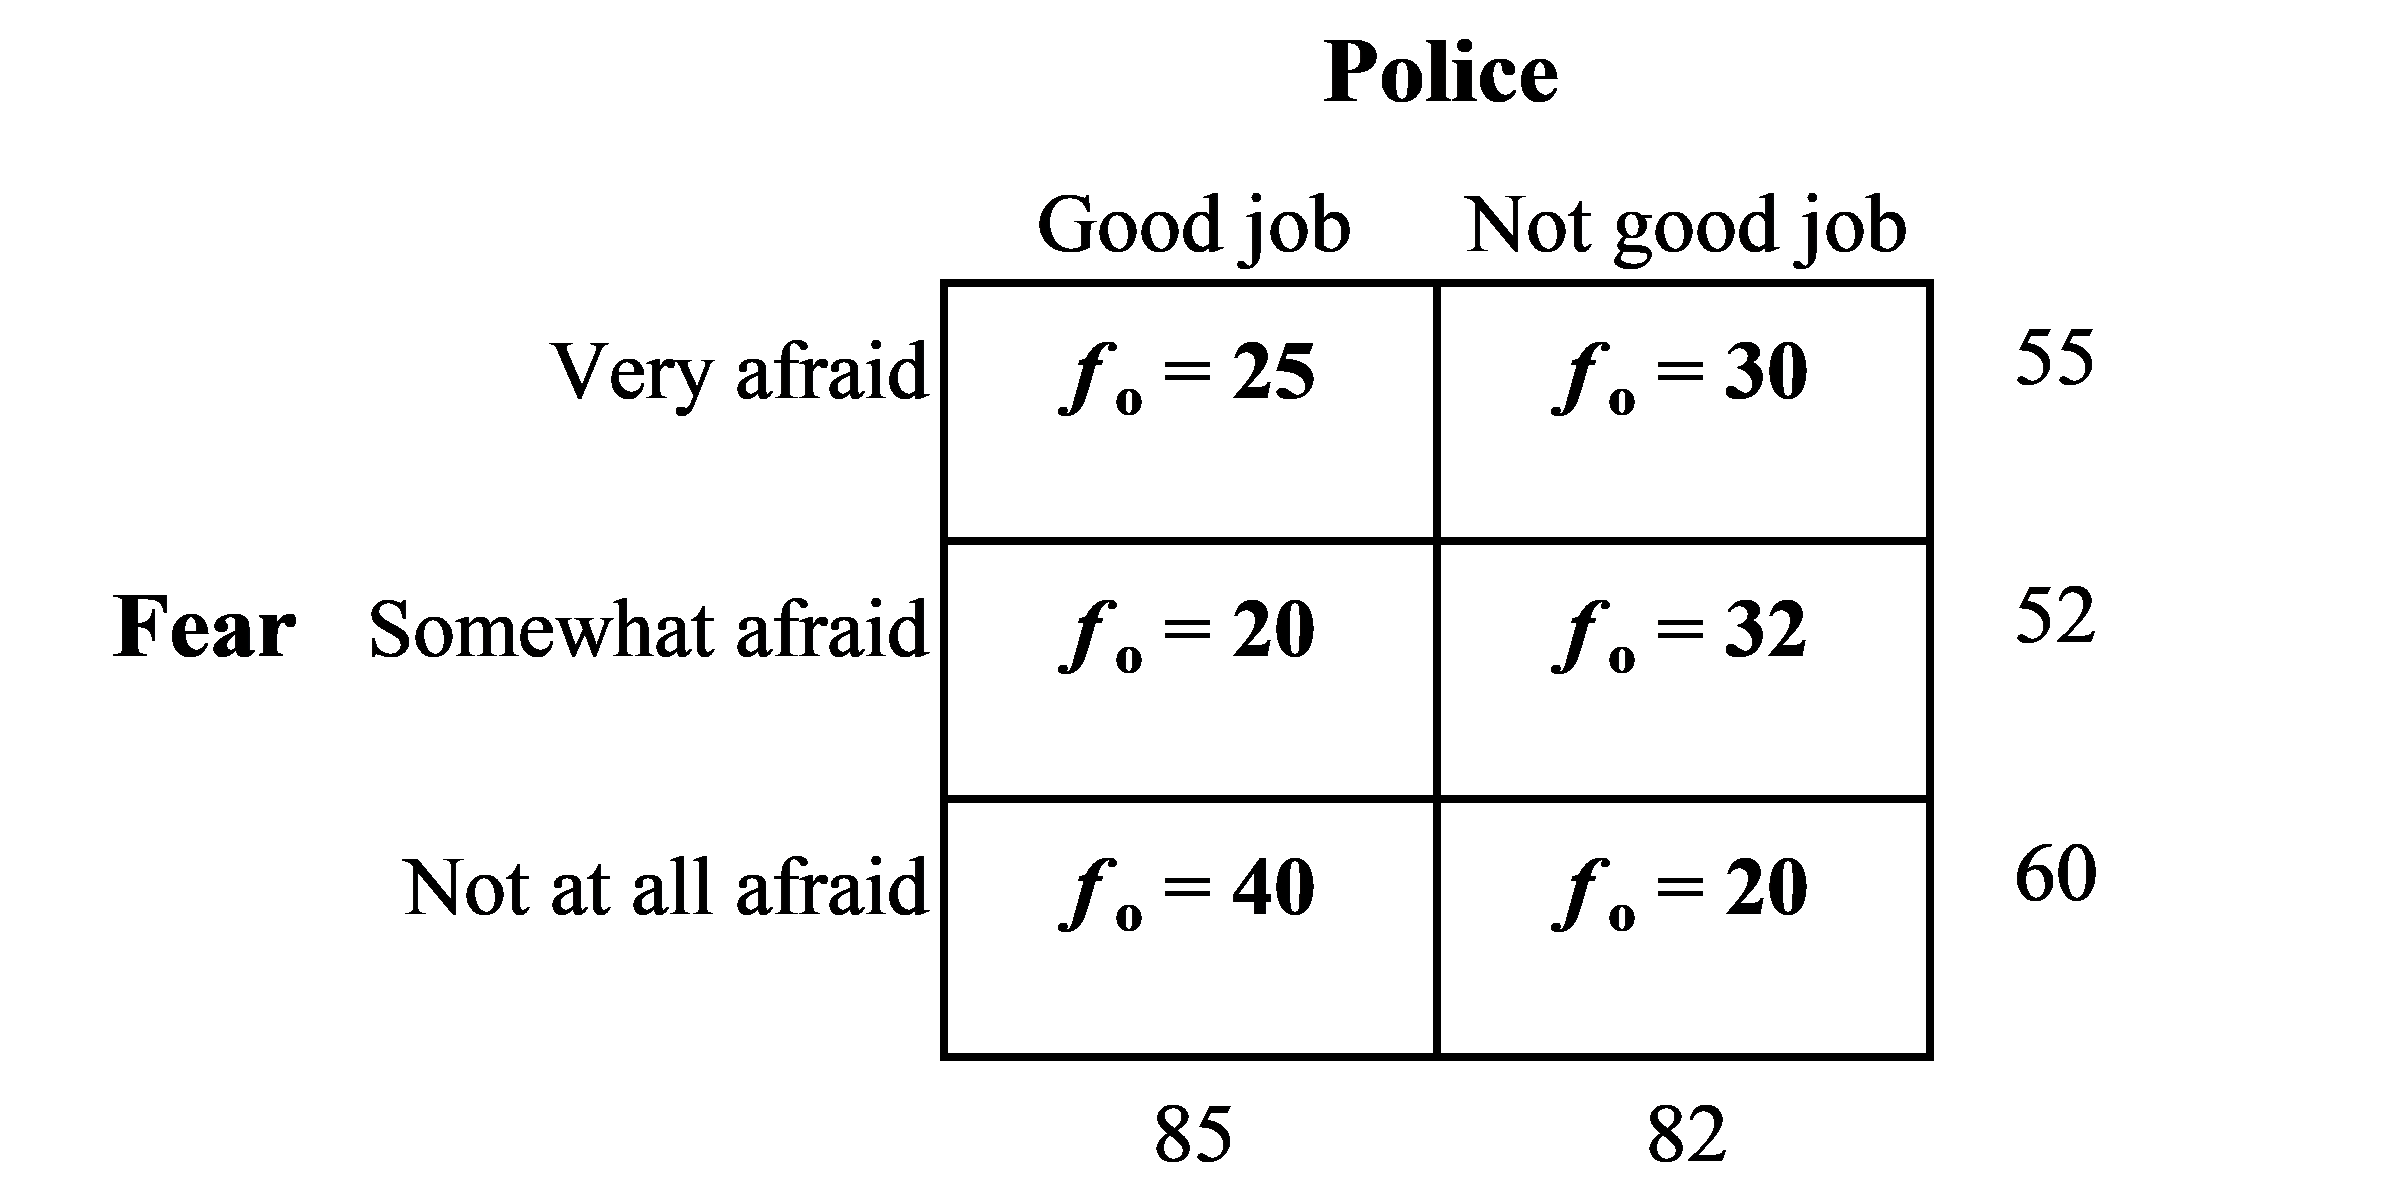
a. 30.54
b. 27.00
c. 25.53
d. 29.46
If you decided to learn how to sew by getting out a needle and thread, then your learning style is likely:
a. visual b. aural c. read/write d. kinesthetic
Which of the following is NOT a critical component of guided writing?
A) Beginning the lesson with a group share session B) Focused attention to writing tasks such as developing a main idea C) Providing immediate input while students write D) Allowing time to complete a piece of writing during the lesson