Use the information given to draw a bar graph. Clearly label the bars. The following table shows the number of male infants born in a certain city on New Year's Day in various years. Make a horizontal bar graph to illustrate the data.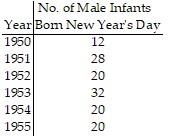
What will be an ideal response?
Answers may vary. The following is a possible answer.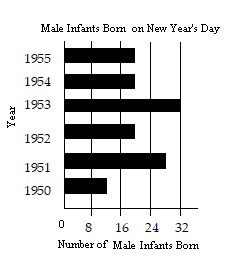
Mathematics
You might also like to view...
Simplify the expression. Assume that all variables are positive.
A. tz2
B. 
C. t2z
D. 
Mathematics
Write the quotient without using exponents.
A. 0.008 B. 0.004 C. 40 D. 80
Mathematics
Approximate the square root to three decimal places.
A. 41.000 B. 6.400 C. 6.408 D. 6.403
Mathematics
Find the zeros of f(x), given that one zero is k.f(x) = 16x4 - 8x3 + 146x2 - 32x + 328 k = 2i
A. ±2i, -  ±
±  i
i
B. ±2i,  ±
±  i
i
C. ±2i, -  ±
±  i
i
D. ±2i,  ±
±  i
i
Mathematics