Graph the function f(x) over the given interval. Partition the interval into 4 subintervals of equal length. Then add to your sketch the rectangles associated with the Riemann sum  , using the indicated point in the kth subinterval for ck.f(x) = x2 - 2, [0, 8], right-hand endpoint
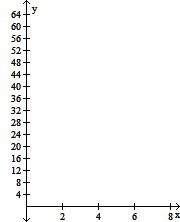
A. 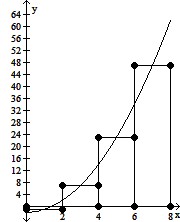
B. 
C. 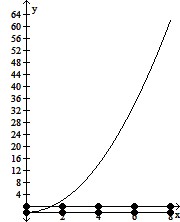
D. 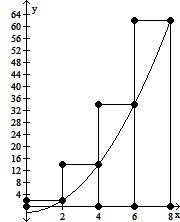
Answer: D
Mathematics
You might also like to view...
Graph the system of linear inequalities.y ? -x + 2y ? 2
A. 
B. 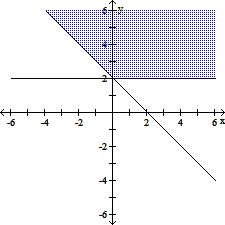
C. 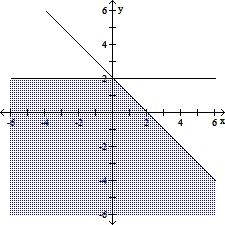
D. 
Mathematics
Give two parametric representations for the equation of the parabola.y = x2 + 4x + 12
A. x = t, y = t2 + 4t + 12 for t in (-?, ?); x = t + 2, y = t2 + 8 for t in (-?, ?) B. x = t, y = t2 - 4t - 12 for t in (-?, ?); x = t + 2, y = t2 + 8 for t in (-?, ?) C. x = t, y = t2 + 4t + 12 for t in (-?, ?); x = t - 2, y = t2 + 8 for t in (-?, ?) D. x = t, y = t2 + 4t + 12 for t in (-?, ?); x = t - 2, y = t2 - 8 for t in (-?, ?)
Mathematics
Solve the equation.(4y + 7)(8y + 21) = 0
A. -  , -
, - 
B. -  , -
, - 
C. 3, 13
D.  ,
, 
Mathematics
Convert the mixed number to an improper fraction.3
A. 
B. 
C. 
D. 
Mathematics