Solve the problem.An accountant tabulated a firm's profits for four recent years in the following table: The accountant then fit both a linear graph and an exponential curve (seen below) to the data, in order to estimate future profits. Use the linear graph to estimate the profits in the year 2001.
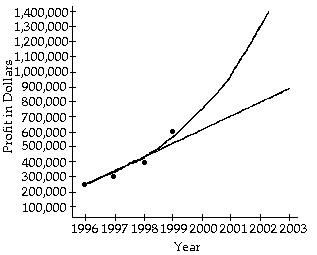
A. About $500,000
B. About $900,000
C. About $700,000
D. About $800,000
Answer: C
You might also like to view...
Find the expected value.An insurance policy sells for $720. Based on past data, an average of 1 in 70 policyholders will file a $10,000 claim, an average of 1 in 100 policyholders will file a $20,000 claim, and an average of 1 in 400 policyholders will file a $50,000 claim. What is the expected value to the company per policy sold?
A. $468 B. $276 C. $252 D. $282
Use a calculator to find the value of y in degrees rounded to two decimal places.y = cos-1 (-0.4541)
A. 117.01° B. -27.01° C. 24.42° D. 27.01°
Find the Social Security tax (6.2%), Medicare tax (1.45%), and state disability insurance deduction (1%) for the employee. Assume the employee is under the FICA and SDI maximums at the end of the current pay period and assume that  is paid for any overtime in a
  week. Round to the nearest cent if needed. Hours Reg FICA Medicare SDIEmployee Worked Rate Tax Tax TaxArnold, N. 41.5 $6.10
A. $15.13, $3.54, $2.44 B. $15.70, $3.67, $2.53 C. $23.54, $5.51, $3.80 D. $15.98, $3.74, $2.58
Find the inverse matrix of A.A = 
A. 
B. 
C. 
D. 