Use the figure to answer the question.The sales figures for the Big "D" Company are shown below in a line graph.Big "D" Sales 
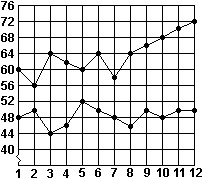
 MonthWhat were the total sales for the first 6 months of 2012?
A. $286,000
B. $64,000
C. $366,000
D. $302,000
Answer: C
Mathematics
You might also like to view...
Find the standard deviation for the given data. Round your answer to one more decimal place than the original data.3, 5, 6, 6, 9, 1
A. 5.4 B. 7.6 C. 2.8 D. 2.5
Mathematics
Perform the indicated operations.0.0089 × 0.016
A. 0.00000142 B. 0.001424 C. 0.00001424 D. 0.0001424
Mathematics
Identify the figure as a line, a line segment, or a ray and name it.
A. line 
B. line segment 
C. ray 
D. line segment 
Mathematics
Solve the problem.A game company has fixed costs of $40,000 per year. Each game costs $12.00 to produce and sells for $18.00. How many games must the company produce and sell each year in order to make a profit of $95,000?
Fill in the blank(s) with the appropriate word(s).
Mathematics