Why is the warmest month of summer different in St. Louis and Oakland?
Six charts showing the average monthly temperature (in °C and °F) for seven U.S. cities are provided (the first letter of each month of the year is shown along the bottom of the charts). For each of the cities, the latitude and longitude, as well as the elevation, are provided.
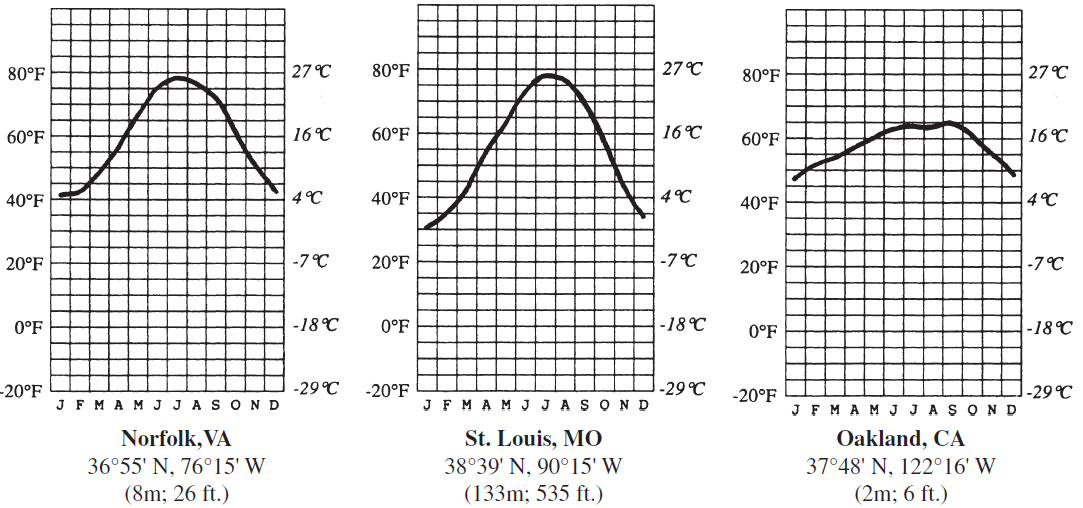
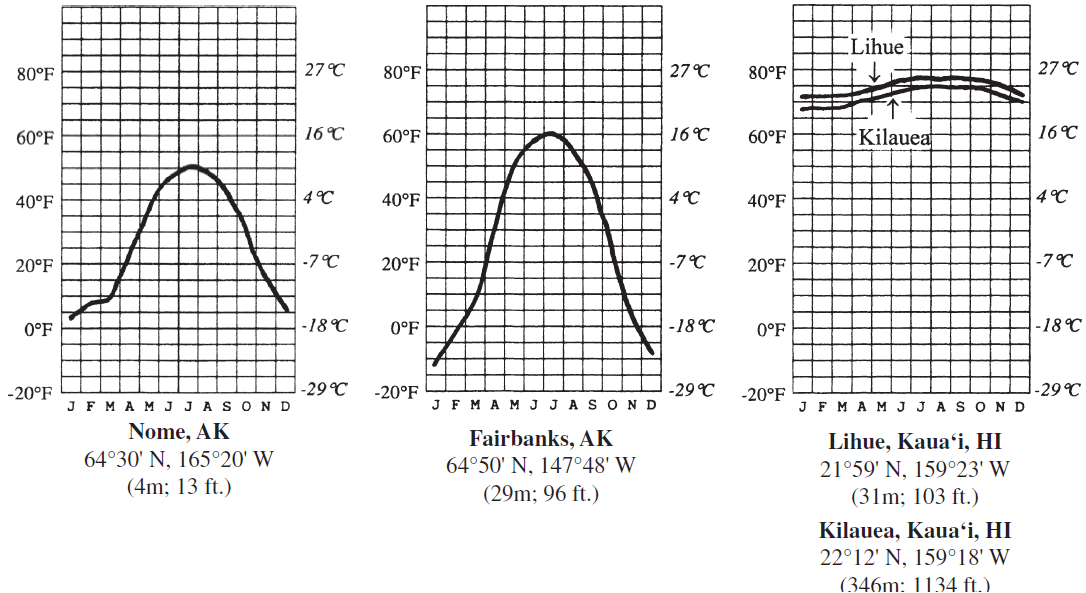
Answer the question by comparing the temperature charts. In your answers, consider the one temperature control factor that is most responsible for the patterns shown (choose from latitude, land–water contrasts, wind patterns, or altitude). You may use the same answer for more than one question. You should locate each of the cities on a world map before trying to answer the question. If altitude is the main factor cited, calculate the expected temperature difference between the two cities based on the average lapse rate.
Land-water contrasts: Maritime locations show lag in reaching temperature peaks compared to continental locations.
You might also like to view...
Where is the projection surface tangent to (touching) the globe? (See end flap of this lab manual.)
Figure 4.5a shows Earth on a planar projection, in which the globe is projected onto a plane. This is a gnomonic projection and is generated by projecting a light source at the center of a globe onto a plane that is tangent to (touching) the globe’s surface. The resulting increasingly severe distortion as distance increases from the standard point prevents showing a full hemisphere on one projection.
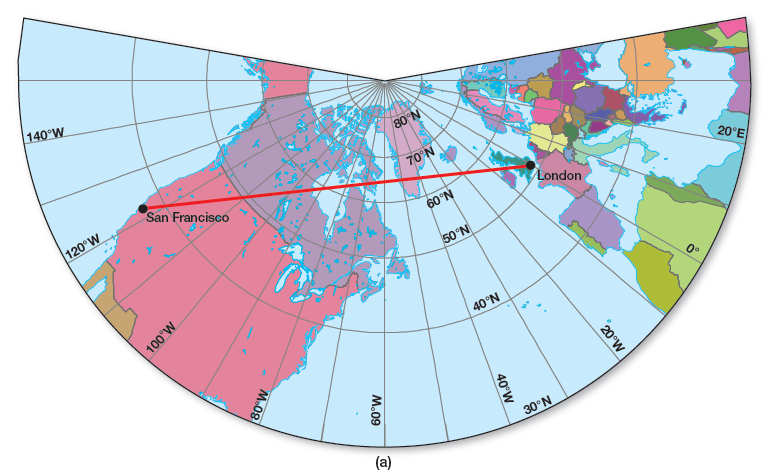
Figure 4.5 (a) Gnomonic/planar projection
Suppose it is warm and raining, and a cold front is moving toward your location. Directly behind
the cold front it is cold and snowing. Still further behind the front the weather is cold and clearing. If the front is scheduled to pass your area in 6 hours, a persistence forecast for your area for 12 hours from now would be: a. cold and snowing. b. cold and clearing. c. cold and cloudy. d. warm and raining. e. not enough information on which to base a forecast.
The uneven distribution of insolation by latitude is primarily a result of
A) variability in the Sun's output. B) migration of the subsolar point throughout the year. C) the changing distance of Earth from the Sun. D) variation in the value of a watt. E) Earth's curvature, which presents varied angles to parallel solar rays.
The atmosphere exerts an average force of approximately 1 kg/ (14.7 lbs/ ) at sea level
Indicate whether the statement is true or false