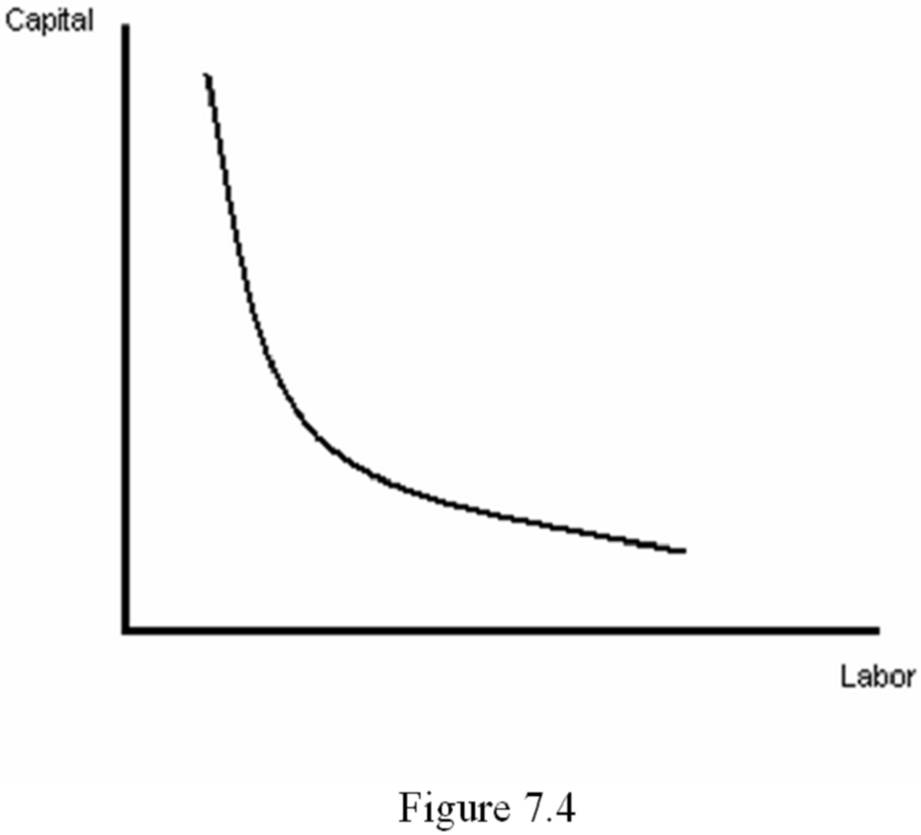
Refer to Figure 7.5. Which diagram represents isoquants for a Cobb-Douglas production function?
A. A
B. B
C. C
D. D
A. A
You might also like to view...
If the economy is characterized by a stable IS curve and an unstable LM curve, then ________ target produces ________ fluctuations in aggregate output
A) an interest rate; larger B) a money supply; smaller C) a money supply; larger D) an exchange rate; smaller
A price floor keeps a price:
a. from rising above a certain level. b. from decreasing below a certain level. c. at a stabilized point. d. from increasing or decreasing.
Which statement about the earned income tax credit is true?
a. Tax break amounts increase with the amount of income earned, up to a point. b. Tax break amounts decrease gradually with the amount of income earned. c. Tax break amounts are determined by the number and age of children in a family. d. Tax breaks are allowed for a maximum of five years.
The supply schedule and the supply curve are just two __________ ways of showing the same information.
a. numeric b. graphical c. identical d. different