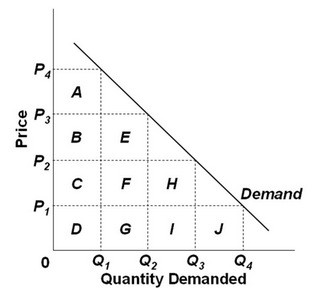
 Refer to the graph above. If the price is P3, then total revenue is represented by areas:
A. E + F + G.
B. B + C + D + E + F + G.
C. A + B + C + D + E + F + G.
D. B + C + D.
Answer: B
You might also like to view...
If demand is perfectly elastic, a sales tax is paid by
A) only the buyers. B) only the sellers. C) both the buyers and sellers. D) None of the above answers is correct.
The difference between the maximum price the consumer is willing to pay and the price the consumer actually pays for a product is referred to as:
a. market surplus b. market shortage c. buyer surplus d. seller surplus.
All four market forms discussed in the text maximize profit where
a. P = MC. b. AR = AC. c. MR = MC. d. MC = AR.
The two main causes of an asset price bubble are:
A. herding and budget deficits. B. herding and budget surpluses. C. budget surpluses and leverage. D. herding and leverage.