The graph shown portrays a subsidy to buyers. Before the subsidy is put in place, the producers sold _____ units and received _____ for each of them.
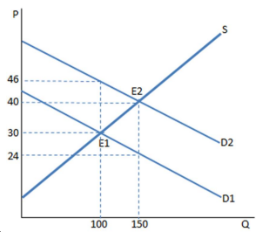
A. 100; $46
B. 100; $30
C. 150; $40
D. 150; $24
B. 100; $30
You might also like to view...
A free good is a good whose existence requires no opportunity cost to produce. How is this different from a good that is offered for a price of zero?
What will be an ideal response?
Aggregate output and the interest rate are ________ related to government spending and are ________ related to taxes
A) positively; positively B) positively; negatively C) negatively; positively D) negatively; negatively
The Department of Justice could use the cross-price elasticity between products sold at Staples and Office Max to show that the firms are very similar.
Answer the following statement true (T) or false (F)
A perfectly inelastic demand curve is
A. a vertical line. B. a horizontal line. C. a line that slopes downward to the right. D. a line that slopes upward to the right.