Indicate whether the graph of the equation is a parabola, circle, ellipse, or hyperbola.9y2 = 144 + 9x2
A. ellipse
B. hyperbola
C. circle
D. parabola
Answer: B
You might also like to view...
For the function represented in the graph, determine the domain or range, as requested.Find the domain.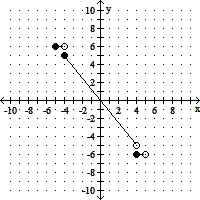
A. {x 
B. {x 
C. {x 
D. {x 
Solve the problem.Suppose that the average monthly low temperatures for a small town are shown in the table. Model this data using f(x) = a sin(b(x - c)) + d. Use the sine regression feature to do this. Approximate all values to one decimal place.
A. f(x) = 25.7sin (0.5(x + 1.6)) + 32.5 B. f(x) = 22.5sin (0.5(x + 3.2)) + 40.7 C. f(x) = 22.5sin (0.5(x + 1.6)) + 40.7 D. f(x) = 22.5sin (1.25(x + 1.6)) + 40.7
Evaluate.7[-7 + 6(-7 + 4)]
A. -67 B. 17 C. -175 D. 21
Use a graphing utility to graph the function over the indicated interval and approximate any local maxima and local minima. Determine where the function is increasing and where it is decreasing. If necessary, round answers to two decimal places.f(x) = x5 - x2; (-2, 2)
What will be an ideal response?