Use the figure above to answer this question. Consider a perfectly competitive market experiencing good times
Figure ________ shows a firm maximizing profit in the short run because it produces ________ units and makes an economic profit of ________. A) A; 100; $2 per unit
B) A; 90; $3 per unit
C) B; 100; $0 per unit
D) C; 100; $3 per unit
E) C; 110; $2 per unit
A
You might also like to view...
If the price of corn chips increases from $2.00 per bag to $3.00 per bag and the quantity demanded goes down from 100 million bags per week to 50 million bags per week, the absolute value of price elasticity of demand in that price range is
A) 0.50. B) 1.67. C) 0.93. D) 2.33.
Zero-down mortgages meant that borrowers were ______.
a. more motivated to find a way to pay their mortgage b. more likely to default and walk away from their mortgage c. less able to borrow more than they could afford d. more able to build equity quickly
The nation closest to a centrally planned, socialist economy is
A. China. B. Japan. C. the United States. D. Norway.
In Figure 20.2, the increase in Real GDP is unlikely to 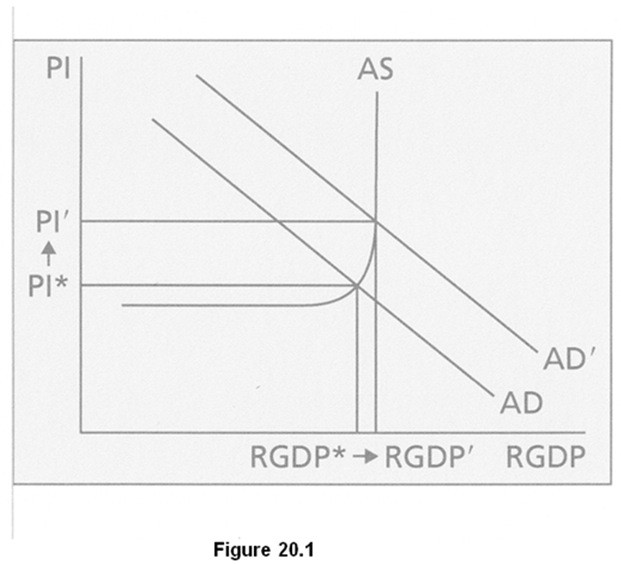
A. occur in developed economies. B. result from a better-educated workforce. C. occur repeatedly in the future. D. result from capital accumulation.