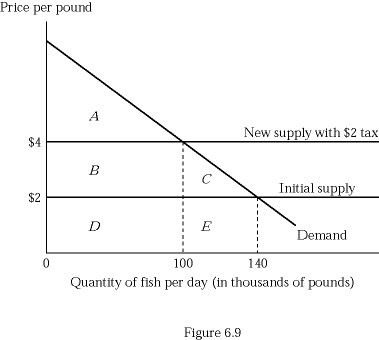
 Figure 6.9 depicts a hypothetical fish market with a horizontal supply curve. Suppose the government imposes a tax of $2 per pound of fish, and the tax is paid in legal terms by producers. Which of the following shows the loss of consumer surplus on the fish that are not consumed because of the tax?
A. Triangle C
B. Rectangle B + Triangle C
C. Triangle C + Rectangle E
D. Rectangle B + Rectangle D
Answer: A
You might also like to view...
In the above figure, income is $8, the price of a soft drink is $1, and the initial price of a milkshake is $2. If the price of a milkshake decreases to $1, milkshakes are revealed to be
A) an inferior good. B) a normal good. C) less preferred than soft drinks. D) None of the above answers is correct.
Dell computers has increased production efficiency by
A) producing output with fewer inputs. B) expanding the amount of inputs used. C) outsourcing production. D) relying on decreasing returns to scale.
"Other things equal, when the price of a good rises, the quantity supplied of the good also rises, and when the price falls, the quantity supplied falls as well.". This relationship between price and quantity supplied
a. is referred to as the law of supply. b. applies only to a few goods in the economy. c. is represented by a downward-sloping supply curve. d. All of the above are correct.
If labor productivity rises at the same time that there is a beneficial supply shock, what is the effect on short-run aggregate supply (SRAS)?
A) SRAS rises. B) SRAS falls. C) SRAS remains constant. D) SRAS may rise, fall, or remain constant.