Use the pictograph to answer the question.This pictograph shows projected sales of compact disks (CDs) for a popular rock band for seven consecutive years. 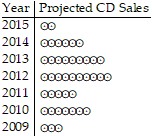 ? = 10,000 CDsBetween which two consecutive years is the greatest decline in sales indicated?
A. Between 2010 and 2011
B. Between 2011 and 2012
C. Between 2014 and 2015
D. Between 2013 and 2014
Answer: C
You might also like to view...
Solve the problem.The basic rule in Fleury's algorithm is
A. only travel across a bridge on the original graph if there is no other alternative. B. only travel across a bridge of the untraveled part of the graph if there is no other alternative. C. never travel across a bridge of the original graph. D. never travel across a bridge of the untraveled part of the graph. E. none of these
Solve the problem.A projectile is fired straight upward. The function  describes the height of the projectile, f(t), in feet, t seconds after firing. Factor the polynomial
  and write the function in factored form. Use the factored form of the function to find f(2).
A. f(t) = -8t(2t - 7); 48 ft B. f(t) = -8t(2t - 7); 80 ft C. f(t) = t(-16t + 56); 48 ft D. f(t) = t(-16t + 56); 80 ft
Compute AB, if possible.A =  and B =
A. 
B. 
C. 
D. 
What part of the object or set of objects is shaded?
A. 
B. 
C. 
D. 