Using Figure 1 above, if the aggregate demand curve shifts from AD3 to AD2 the result in the long run would be: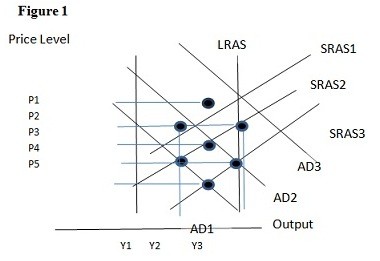
A. P1 and Y2.
B. P2 and Y1.
C. P3 and Y1.
D. P3 and Y2.
Answer: D
You might also like to view...
Use the following diagram to answer the next question.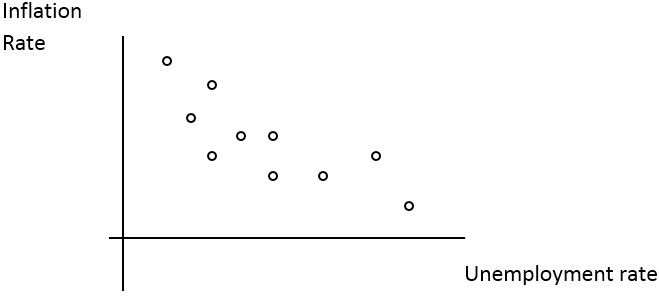 Consider the data points shown in the diagram, the observations range from the oldest on the right to the most recent observations on the left. Based on these observations we can say ________.
A. the evidence shows a positive relationship between unemployment and inflation B. the evidence shows a negative relationship between unemployment and inflation C. the evidence shows there is no relationship between unemployment and inflation D. there is not enough evidence to determine the relationship between unemployment and inflation
Saving remaining constant, the average propensity to save declines with an increase in disposable income
a. True b. False Indicate whether the statement is true or false
Which of the following is the best example of a government effort to address market failure in relation to the FOR WHOM to produce question?
A. Transfer payments. B. The production of goods that allow free riders. C. Antitrust policy. D. Regulations reducing pollution.
Suppose Lois usually buys two cups of coffee for two dollars each and one scone for two dollars each. If the price of scones falls to one dollar each and she now buys two cups of coffee and two scones, this illustrates the
A. substitution effect. B. marginal rate of substitution. C. real-income effect. D. total utility effect.