Use the information given to draw a bar graph. Clearly label the bars. The following table shows the number of male infants born in a certain city on New Year's Day in various years. Make a horizontal bar graph to illustrate the data.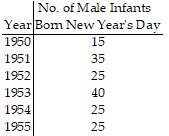
What will be an ideal response?
Answers may vary. The following is a possible answer.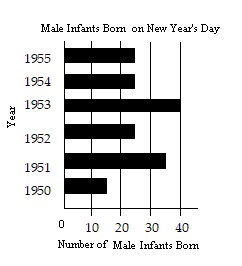
Mathematics
You might also like to view...
Find the volume of the described solid.The solid lies between planes perpendicular to the x-axis at  and
and  . The cross sections perpendicular to the x-axis between these planes are squares whose bases run from the semicircle
  to the semicircle
  .
.
A. 
B. 
C. 
D. 
Mathematics
Evaluate the line integral along the curve C. ds , C is the curve r(t) = 3ti + (9 cos
  t)j + (9 sin
  t)k , 0 ? t ?
  ?
?
A.  +
+ 
B.  ?2 +
?2 + 
C.  ?
?
D.  ?2 + 81
Mathematics
Divide.(-15x3 - 34x2 - 21x - 10) ÷ (3x + 5)
A. -5x2 - 3x - 2 B. -5x2 - 2 C. x2 + 3x + 2 D. x2 - 3x - 2
Mathematics
Explain why the function is not a polynomial function.f(x) = 
What will be an ideal response?
Mathematics